This is a repost of an article I wrote for LinkedIn's engineering blog. To see the original, please visit here.
At LinkedIn, we use a log-centric system called Apache Kafka to move tons of data around. If you're not familiar with Kafka, you can think of it as a publish-subscribe system that models each message as a log entry.
However, it's difficult for a developer to spend their time thinking about a problem domain relevant to their application in addition to the complex fault tolerant semantics required to work with the log (Kafka's ISR is up there with Paxos in terms of understandability).
What is Samza?
Apache Samza is a framework that gives a developer the tools they need to process messages at an incredibly high rate of speed while still maintaining fault tolerance. It allows us to perform some interesting near-line calculations on our data without major architectural changes. Samza has the ability to retrieve messages from Kafka, process them in some way, then output the results back to Kafka. A very simple Samza application looks a bit like this:

Although Samza is designed to work with many types of streaming systems, at LinkedIn we primarily depend on Kafka for message streams. So, before diving into how we run Samza at LinkedIn, let's start with Kafka and some related terminology.
Kafka Lingo
Every day at LinkedIn, Kafka is ingesting over half a trillion messages (about 500 terabytes). You might be picturing a massive cluster that magically handles this number of messages without falling over, but that's not really accurate. What we really have is a graph of clusters that each handle specific types of messages. We control the flow of messages from cluster to cluster by mirroring messages through the directed graph of clusters.
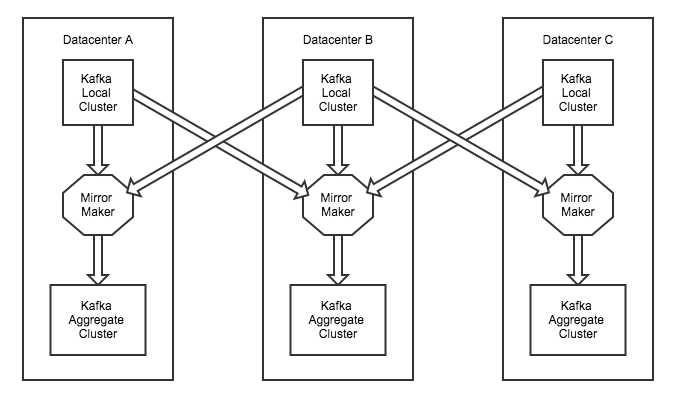
To have the ability to fail out of data centers, we usually provision our clusters with a topology that keeps messages around when a data center goes completely offline. In each datacenter, we have a concept of local and aggregate Kafka clusters. Each local cluster is mirrored across data centers to the aggregate cluster. So, if one datacenter goes down, we can shift traffic to another without skipping a beat.
Each horizontal layer in the topology is what we refer to as a "tier". A tier is the set of clusters across multiple data centers that perform the same function. For example, in the diagram shown above, we have a "local tier" and an "aggregate tier". The local tier is the set of all local clusters in every data center and the aggregate tier is the set of all aggregate clusters in every datacenter.
We also have another tier that we refer to as the "offline aggregate tier". The production aggregate tier is mirrored to the "offline aggregate tier" for batch processing (for example, a map-reduce job that utilizes Hadoop). This allows us to separate production and batch processing into different datacenters.
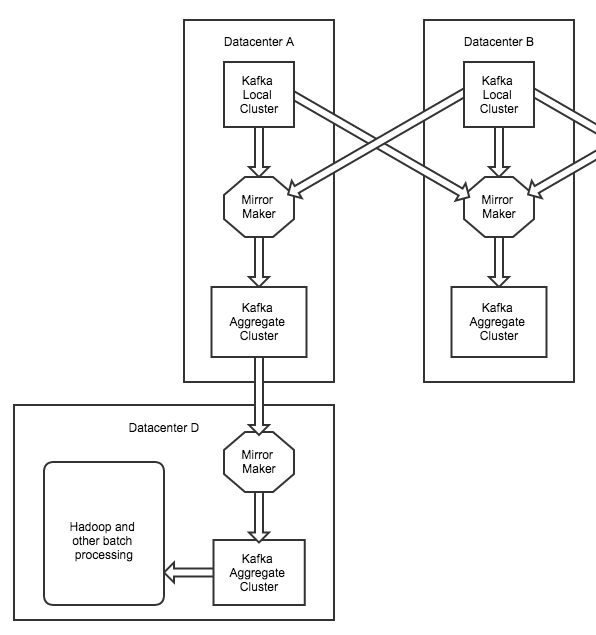
Since having a single local cluster or a single aggregate cluster within a datacenter would result in huge clusters with reliability risk, we split up the local cluster into several clusters, each for a different category of data. For example, application metrics (such as a message that contains a sample of CPU usage) and tracking events (for example, an advertisement impression event message) are sent to different clusters, each with their own local and aggregate clusters. Kafka could probably handle a single huge cluster for every type of message we throw at it, but splitting things up gives us a better chance of elegantly dealing with complex failures.
We also have another term which we refer to as a "pipeline". A pipeline is the path that a message travels from source to destination. For example, here's how a "metrics pipeline" might work. First, a production application produces a message that says something like 35% of memory is being used on a host. That message will be sent by the application to the production metrics local tier. Then, the message will be mirrored to the production metrics aggregate tier, then again to the aggregate metrics offline tier. Finally, the metric will be consumed by the long term storage system designed to display pretty graphs and emit alerts for employees. This path from producer to consumer across all datacenters is what we refer to as a pipeline. Many messages share common pipelines, so it's a nice way to quickly describe where a message is going or where it came from.
So, how does Samza fit into this? We have another set of Kafka clusters dedicated to Samza jobs that are mirrored from the aggregate tiers. Each of these Kafka clusters for Samza has an associated cluster that runs Apache YARN for launching Samza jobs.
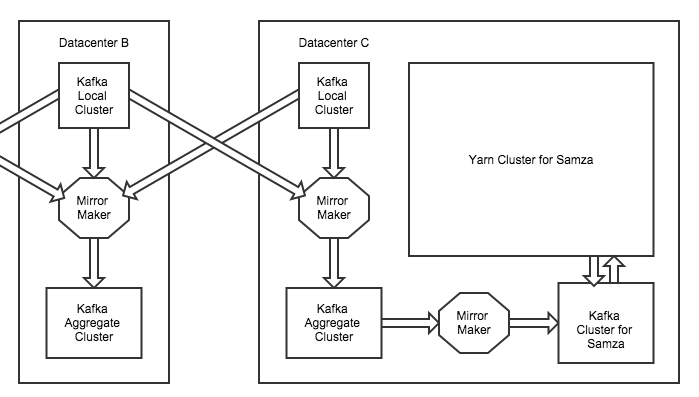
You may notice in the diagram above that Kafka and Samza do not share the same hardware. In the past, we colocated both Kafka and Samza on the same hardware, however we ran into issues when Samza jobs would interfere with Kafka's page cache. So, for now, we've separated them onto different hardware. In the future, we'd like to explore the locality of Samza and Kafka (for example, a task and the paired partition leader or partial ISR would share the same rack), but this is what works well for us at the moment.
Resource Management
Although the (very) modular design of Samza should make it simple to support almost any resource manager in the future, YARN is currently the only option at the time of this writing. At job launch, each Samza job links into YARN's Application Master API. Through this API, Samza works with YARN to request resources (containers) to run Samza tasks in. When a task fails, the Samza job negotiates with YARN to find replacement resources.
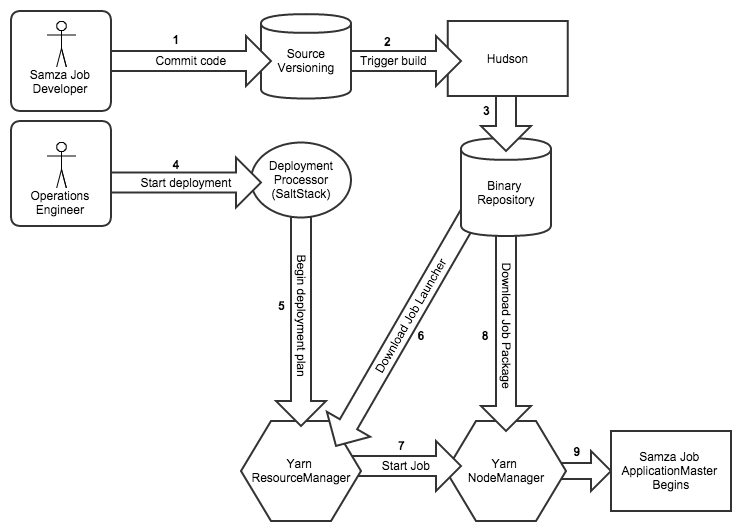
So, how do we get to the point where we're starting up a Samza job to run under YARN? Over time, LinkedIn has built internal tooling designed to simplify and automate software building and testing, so we utilize this to write, build and deploy Samza jobs.
First, a developer creates a Samza project. LinkedIn's tooling then creates a version control repository (git or subversion, depending on developer preference). Every time they commit to this repository, automated tooling builds the project using Hudson to create a Samza job package. After tests and other post commit tasks are finished, this job package is then automatically versioned and uploaded to our Artifactory binary repository. Once the job package is available in Artifactory, other tools then install a small set of files onto the same host as the YARN ResourceManager. One of these files is a script that tells YARN to download the job package from Artifactory, unpack it into the job's working directory, and to launch the Samza Application Master.
Metrics, metrics, and more metrics
Once the job is running under YARN, our job isn't over yet -- it's time to monitor everything. We have the luxury of using something we call "inGraphs" to accomplish this. inGraphs is very similar to the open source Graphite with a backend based on RRD, Whisper, or InfluxDB. When a Samza job starts up at LinkedIn, by default, metrics are produced to Kafka and consumed by inGraphs.

Since Samza jobs can easily produce tens of thousands of metrics per second, we've introduced a default metrics blacklist that keeps things a bit quieter until an engineer actually needs the data. Holding onto historical metrics and making it easily accessible (everything from young generation size to process callback latency) is an extremely valuable tool that shouldn't be overlooked.
While being able to visualize metrics is useful, it's even more important to have the ability to create alerts and take actions based on those metrics. We have another application at LinkedIn which we call "AutoAlerts". AutoAlerts has a language (mostly YAML) for alerting on metrics which is similar in functionality to the alert related features in Riemann or Cabot.
For most alerts, we just have a minimum and a maximum threshold defined. For example, in the screenshot below, we have a threshold of 100 messages per second (per task) defined as the minimum threshold. If the job throughput on any task goes below this value, the appropriate action will be taken (automatic remediation or on-call notification).
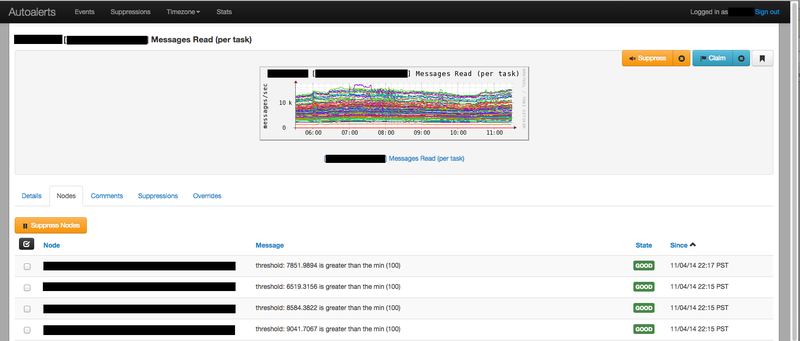
Every alert we create has an escalation path. Some alerts simply send an email for things that don't need immediate attention, such as a minor hardware failure that successfully failed over. Other alerts, such as those for a non-responsive load balancer would be escalated to the central network operations center who would then engage the appropriate person on-call for the service.
The metrics we monitor vary. For example, we have thresholds set on the Application Master heap size. If the heap size falls below a certain threshold, we know there's a good chance the job is having trouble. We also have several alerts for YARN, including the number of unhealthy NodeManagers, JVM metrics, and number of active Resource Masters (in regards to high availability). We also graph out the number of jobs which are killed by YARN or have failed for any other reason.
Outside of Samza, we also monitor disk (IOPS and bytes available), CPU, memory, and network usage (local interfaces, rack switches, and all uplinks). We also have a few hardware-specific alerts, such as boolean alerts for the health of SSDs.
One particular type of alert I'd like to emphasize is the capacity alert. We have thresholds set which are based on historical growth and lead time to order hardware. When this alert goes off, we know that it's time to plug in our current capacity and growth projections into a model that provides an estimate on how much hardware we need to order. Since we're currently limited by memory and have very rapid growth, we aim to keep 50% of memory in use by Samza jobs at all times (in other words, we double the size of all clusters every time we order hardware). As the platform matures and growth slows relative to the total size of all clusters, we expect to slowly increase this target from 50% (probably settling at around 85% with peak traffic while still having 15% for unexpected growth).
In addition to the metrics we monitor, we also graph out a ton of other data points without setting thresholds (as many as our monitoring system can handle). When a mysterious or subtle problem is encountered, having the ability to quickly skim through thousands of data points at a glance often uncovers the root of the problem, or at least points us in the general direction of what we need to investigate further.
Hardware configuration
When we order new hardware for Kafka brokers, we use the standard LinkedIn Kafka configuration. Our Kafka brokers for Samza are exactly the same as our regular brokers (except for relaxed thresholds on a low number of under-replicated partitions).
So far, at current scale, we've found that our jobs are usually memory bound. So, for nodes that run Samza tasks, we primarily look for a healthy RAM to core ratio (we currently aim for 12 cores, 2 hardware threads per core, and 64GB of RAM per server). Moving forward, we expect this to change -- likely with network as the next limiting factor.
For jobs that utilize Samza's key-value store, we typically use a PCI-E based SSD with a terabyte or two of available space. Unlike the SSDs on our Zookeeper clusters, we typically don't worry about GC pauses as long as overall throughput remains high.
Moving forward
Although we haven't had many stability issues with Samza, we'd like to make this entire system more robust as we grow larger. One thing we'll be improving soon is how we handle job and task isolation. We've experimented with cgroups and namespaces in various forms, but have yet to settle on a path that makes us completely happy (mostly when it comes to disk isolation).
Another area we'd like to explore is a self-service model where developers have minimal interaction with reliability engineering when they create new Samza applications.
So, that's it for my overview of how we operate Samza at LinkedIn. We've had a significant amount of success in working with Samza and plan to use it for many new tasks in the upcoming year.